HTB Writeup: Debugging Interface
Debugging Interface is a HackTheBox challenge created by diogt. It is part of the "Intro to Hardware Hacking" track.
Description
We accessed the embedded device's asynchronous serial debugging interface while it was operational and captured some messages that were being transmitted over it. Can you decode them?
Step 1: Obtain debugging_interface_signal.sal
Download the zip file from the challenge portal, and unzip it. The password is hackthebox. You will see debugging_interface_signal.sal
Step 2: Unzip the .sal file
I started my analysis by running the file command on debugging_interface_signal.sal. This revealed that the file contains some archived data.
└─$ file debugging_interface_signal.sal
debugging_interface_signal.sal: Zip archive data, at least v2.0 to extract, compression method=deflate
Upon unzipping debugging_interface_signal.sal, I received two additional files:
digital-0.bin
meta.json
meta.json had a bunch of data, but none of it seemed particularly useful. So, I moved on to digital-0.bin.
Step 3: Analyzing digital-0.bin
At the beginning of my analysis, I ran the strings command to get an idea of what is in the file. I immediately saw an interesting header.
└─$ strings digital-0.bin | head
<SALEAE>
<snip>
Step 4. Using SALEAE Logic Analyzer
SALEAE is a logic analyzer. So, I downloaded the demo, and imported the .sal file.
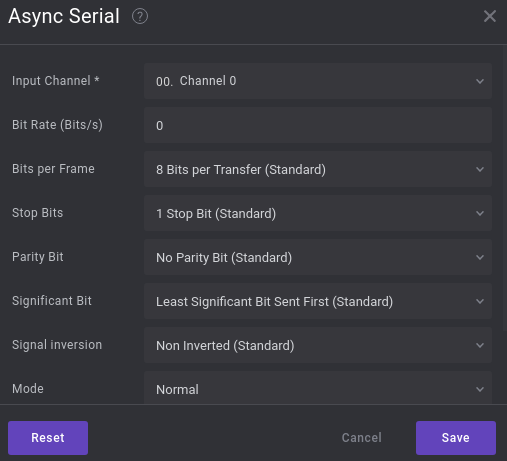
I went to SALEAE's analyzer tool, clicked on Async Serial, and selected 00. Channel 0 as the Input Channel. This is when I discovered that I also needed a Bit Rate (Bit/s) value.
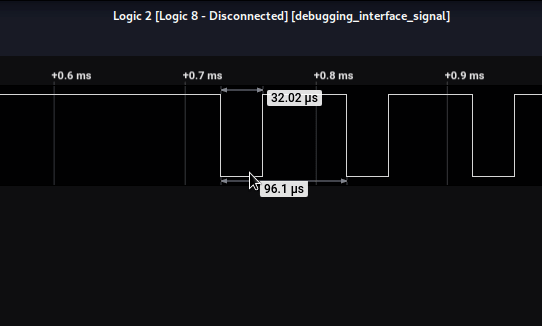
I calculated the bit rate by going to the start of the data. I hovered my mouse over the first block of data and saw a value of 32.02 µs. However, that is microseconds, and SALEAE needs seconds. So, I divided 1,000,000 by 32.02 to get 31230 Bit/s.
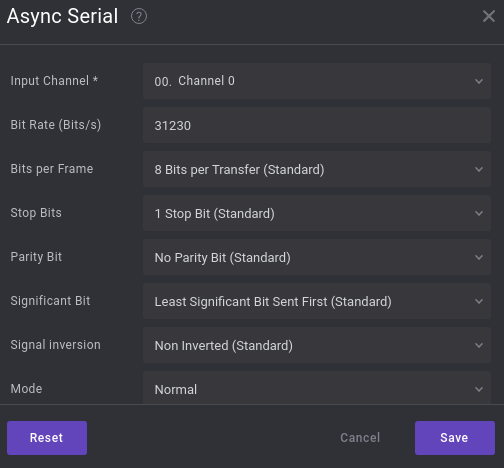
I then entered this into the Async Serial analyzer with the other default values and clicked Save.
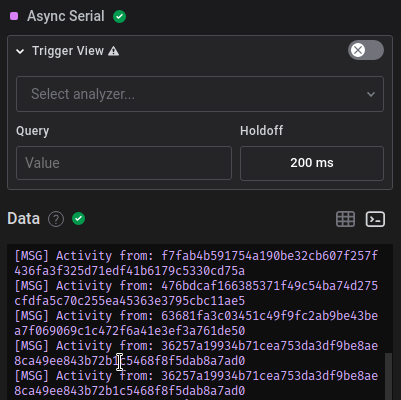
This decoded the data. To read it in plaintext, click on the Terminal button. The flag is at the bottom (not shown in the picture)!
Happy hacking :)


